Foodie Fanatic Website Design
Information Architecture
Information Architecture

R Base Programming

Design Thinking

Information Visualization

Web Development

UX Design
Foodie Fanatic endeavors is to inspire, educate and outfit customers for a lifetime love of food and cooking. The Foodie Fanaticwebsite serves as the primary means of online interaction with customers. It is a place where people can research and purchase products that are sold by Foodie Fanatic, locate expert advice, events and other information related to the food industry, and interact and engage with the company and other customers.
BUILT FOR:INFORMATICS 330 - Information Architecture
(Winter 2017)
ROLE: User Experience Lead, UX Designer, Taxonomist
CREATED WITH: Basalmiq, Figma, Taxonomy Cards
Foodie Fanatic users are in need of a website that is easy to navigate and obtain desired information that is accessible to everyone. Users want a site tailored to their individual needs, so users are not forced to deal with unwanted information.
To drive product sales and inform customers of the latest trends relating to food, with the intention to ultimately engage and excite customers about the Foodie Fanatic brand.
In order to approach this problem, we would have to define what our agenda is.
We are here to help you drive product sales and inform users of the latest trends relating to food. Whether it be recipes, cookware, or ingredients, we intend to ultimately engage and excite users about the Foodie Fanatic brand.
Our current problems that our existing that our users are having is that many users feel that the site is cumbersome and difficult to navigate. This often leads users to search other resources for their needs. Also, the users are not aware of the breathe of offerings from Foodie Fanatic. Users do not realize that Foodie Fanatic has extensive recipes, instructional content presented via multi-media and food related events and classes. Most importantly, users are confused about about the site contains.
For the purpose of this project, with business and content goals in mind. To remedy some of the issues above, I have put forth a series of principles when redesigning Foodie Fanatic. Our ease of access, espicially on mobile should be our top priority first because the majority of our users would use this application on a mobile device, instead of desktop computers. Thus, having a mobile first approach would be ideal. The users stated that the site is confusing to look and and does not understand what it really contains. Therefore, a clarity and relevance to what the user is looking for is another value that sohuld be focused on. A sense of community as well as social interaction between users should be encourages and promote the growth of this product and encourage the involvement and inclusion of all users with varying skills, backgrounds, and experiences. Our online strategy is to develop a social media platform centered around food, allowing users to interact with a diverse group of foodies. This includes staying conected with their community by keeping up with the latest events, share personal content, voicing their opinions, providing feedback to other foodies, and further establish their credentials within their community.
Given the problems that were discusses with the conflicts of the original website/mobile application, focusing and analyzing popular food websites like Williamson Sonoma is important because of how successful their website is.
A model of our websites/phone application content designed to help both users and search engines navigate the site.

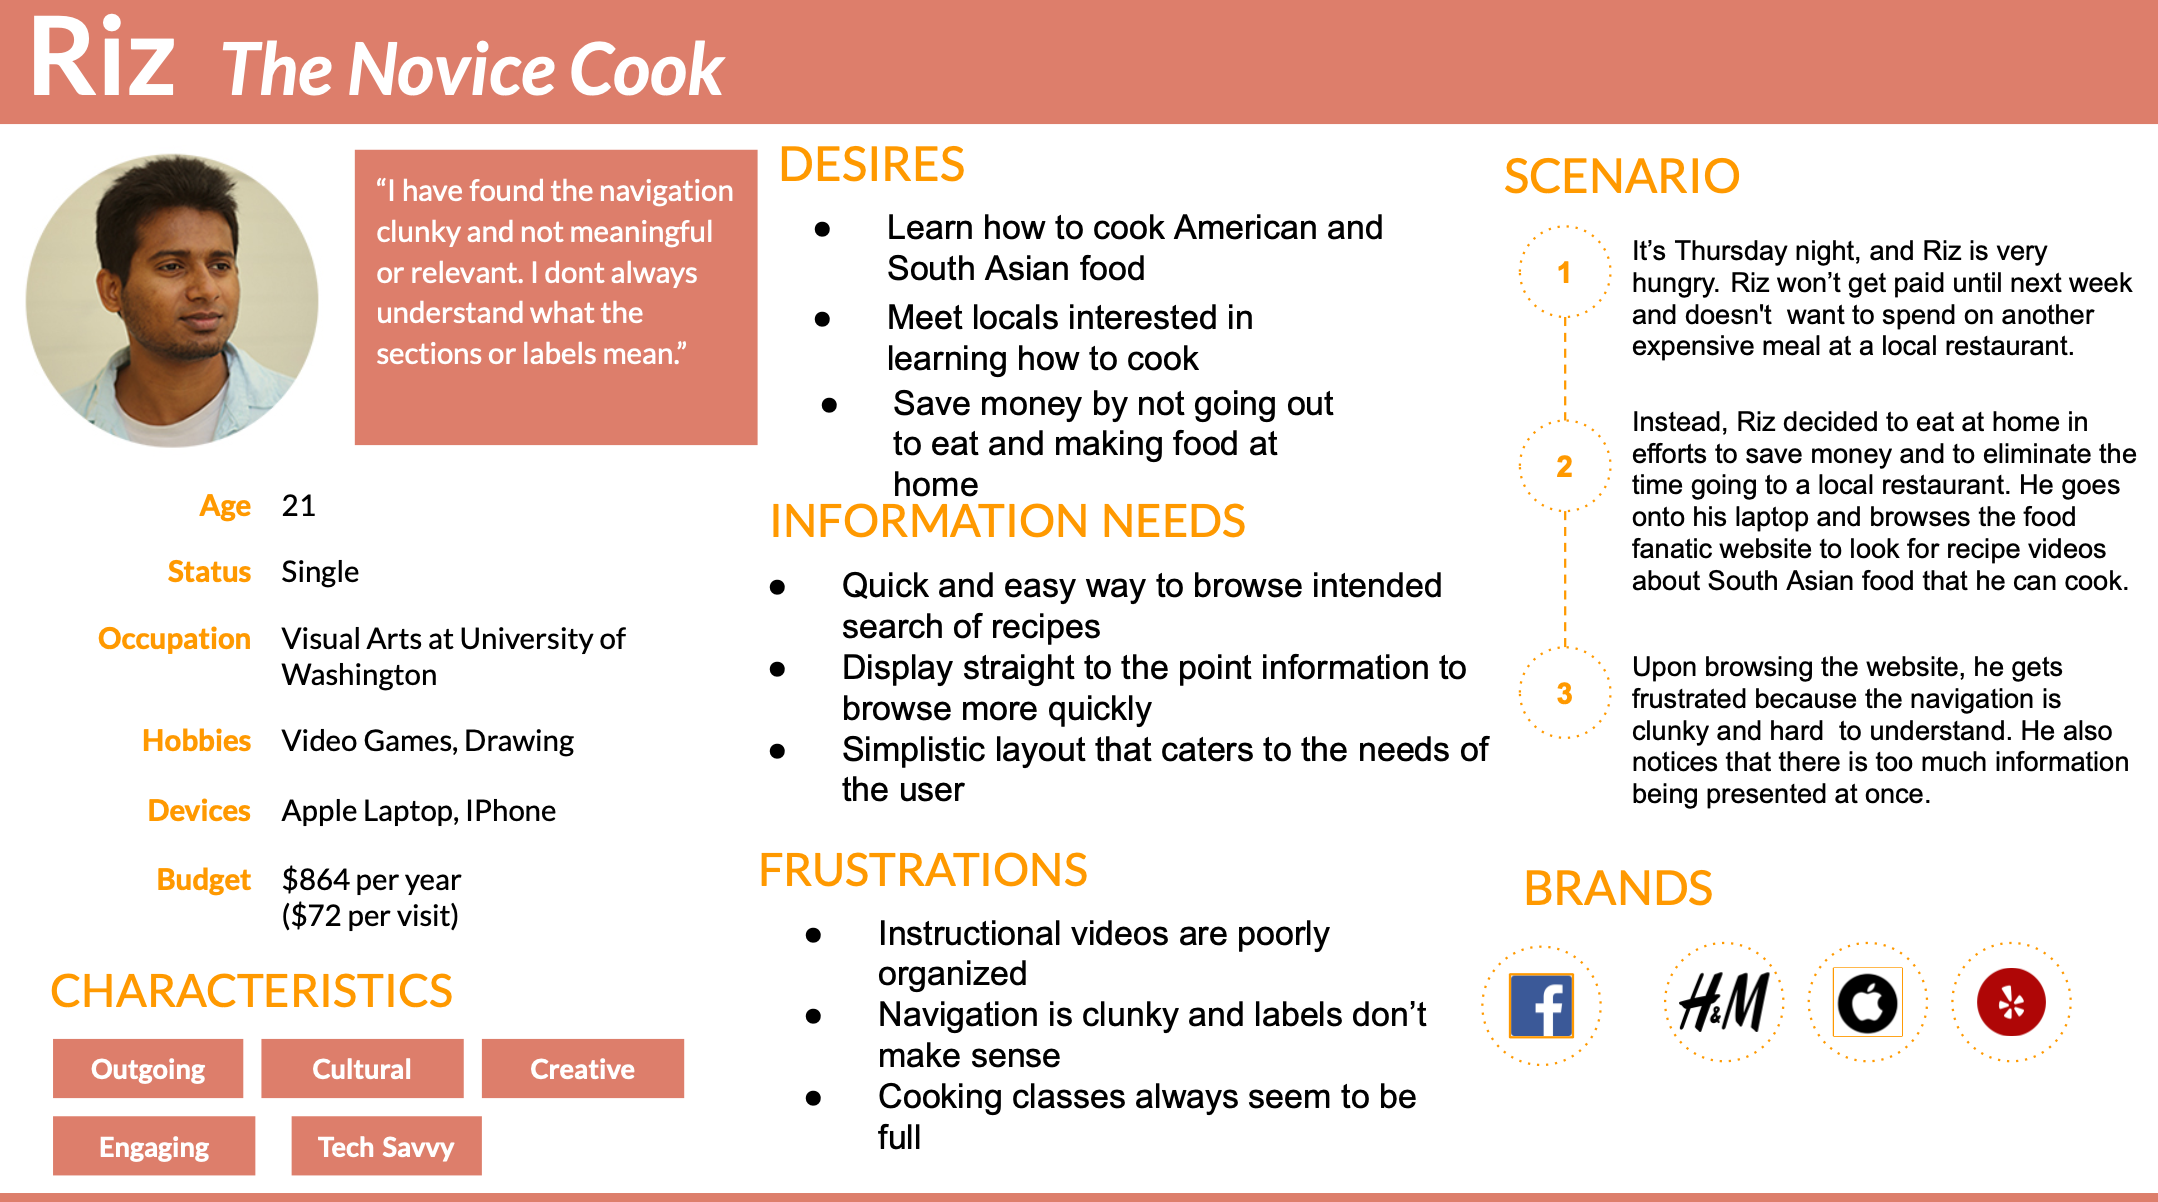
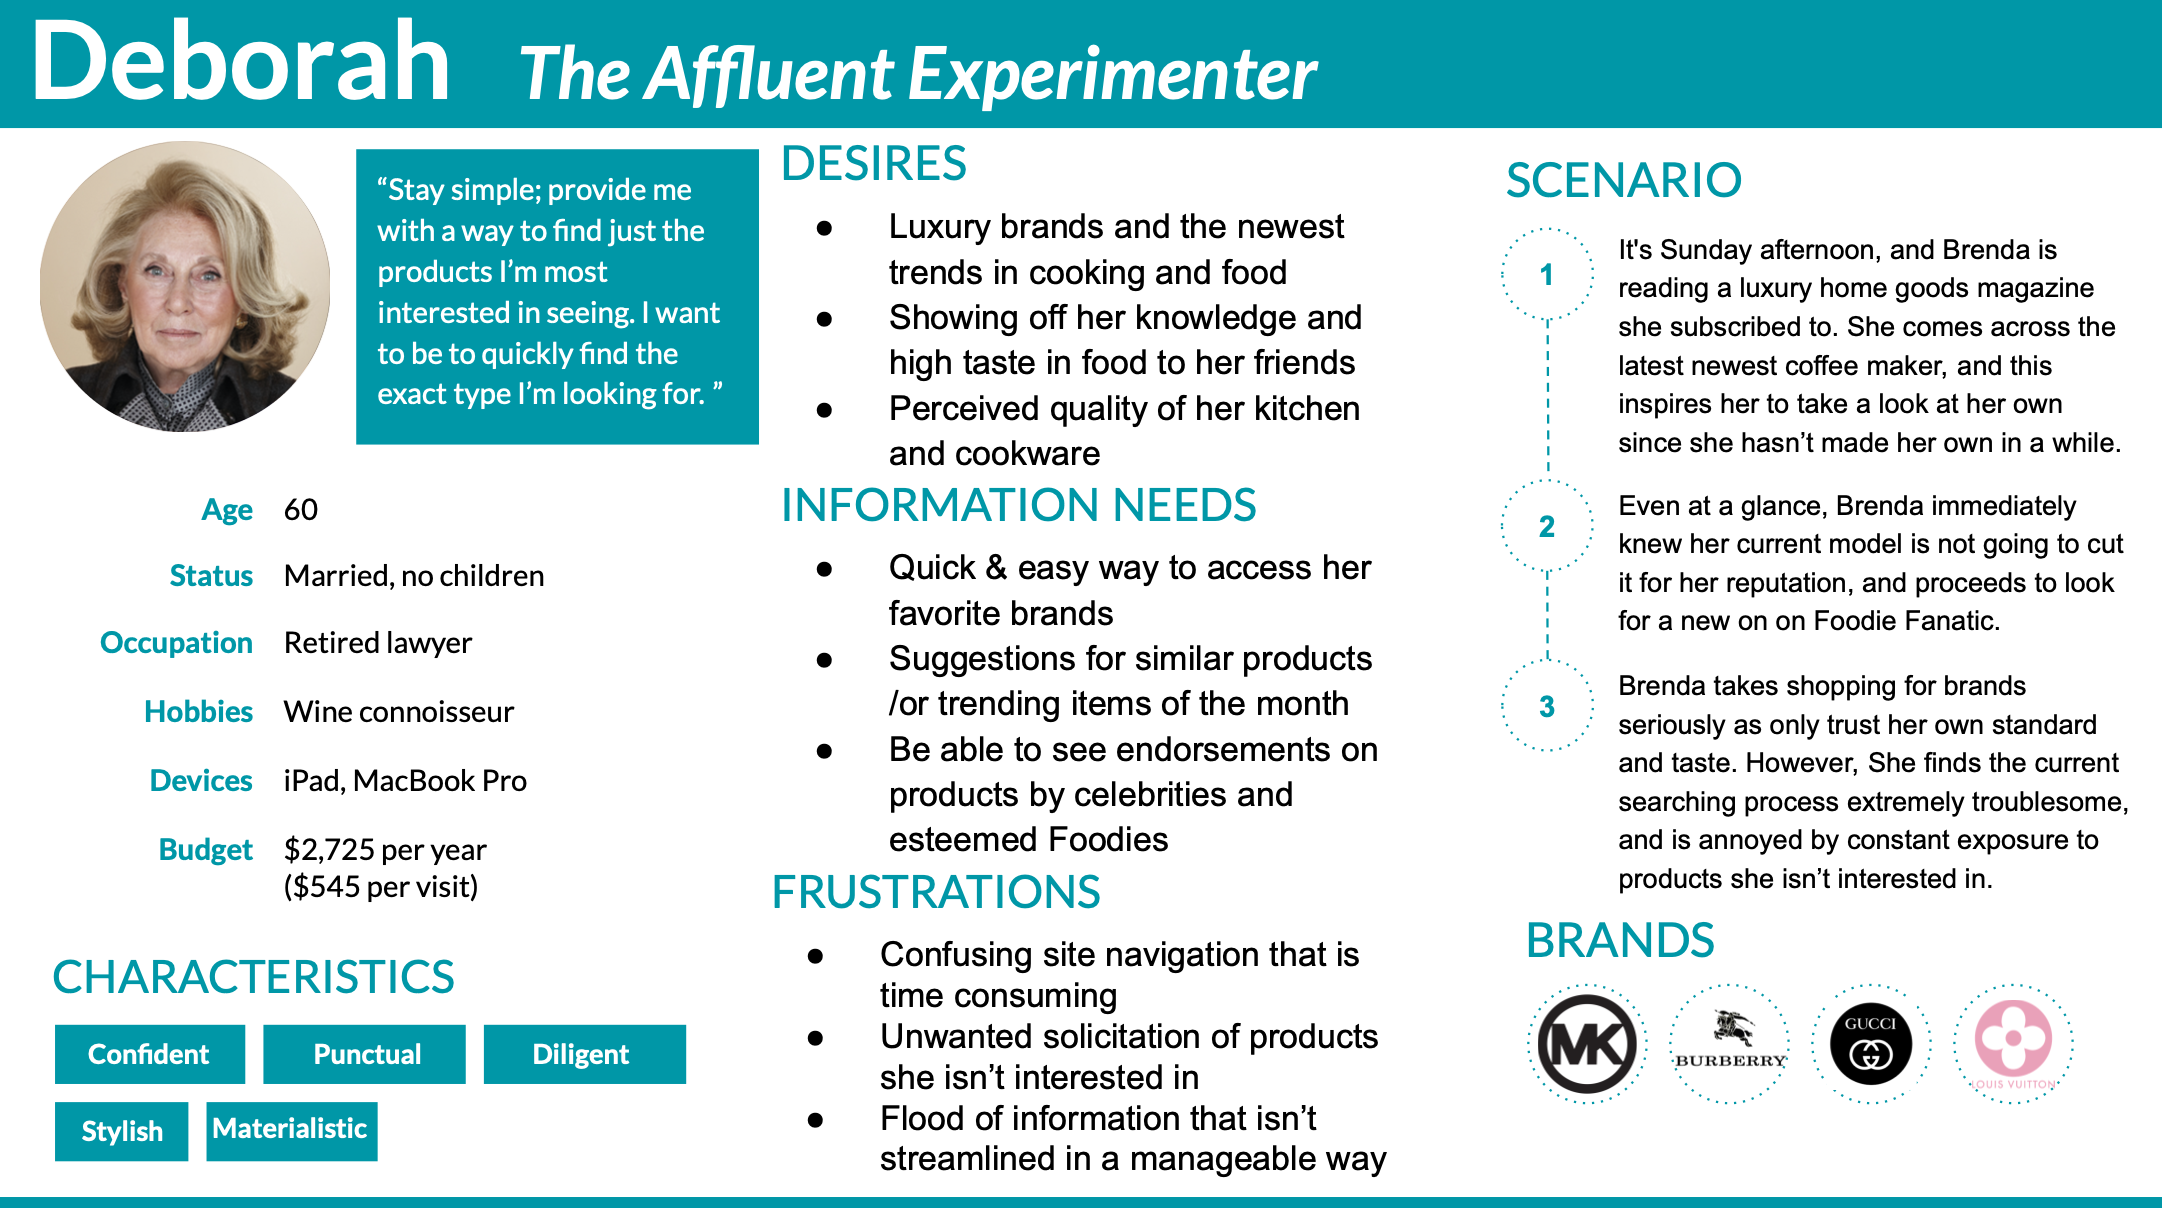
Created user personas to tackle our major problems given people with different backgrounds:


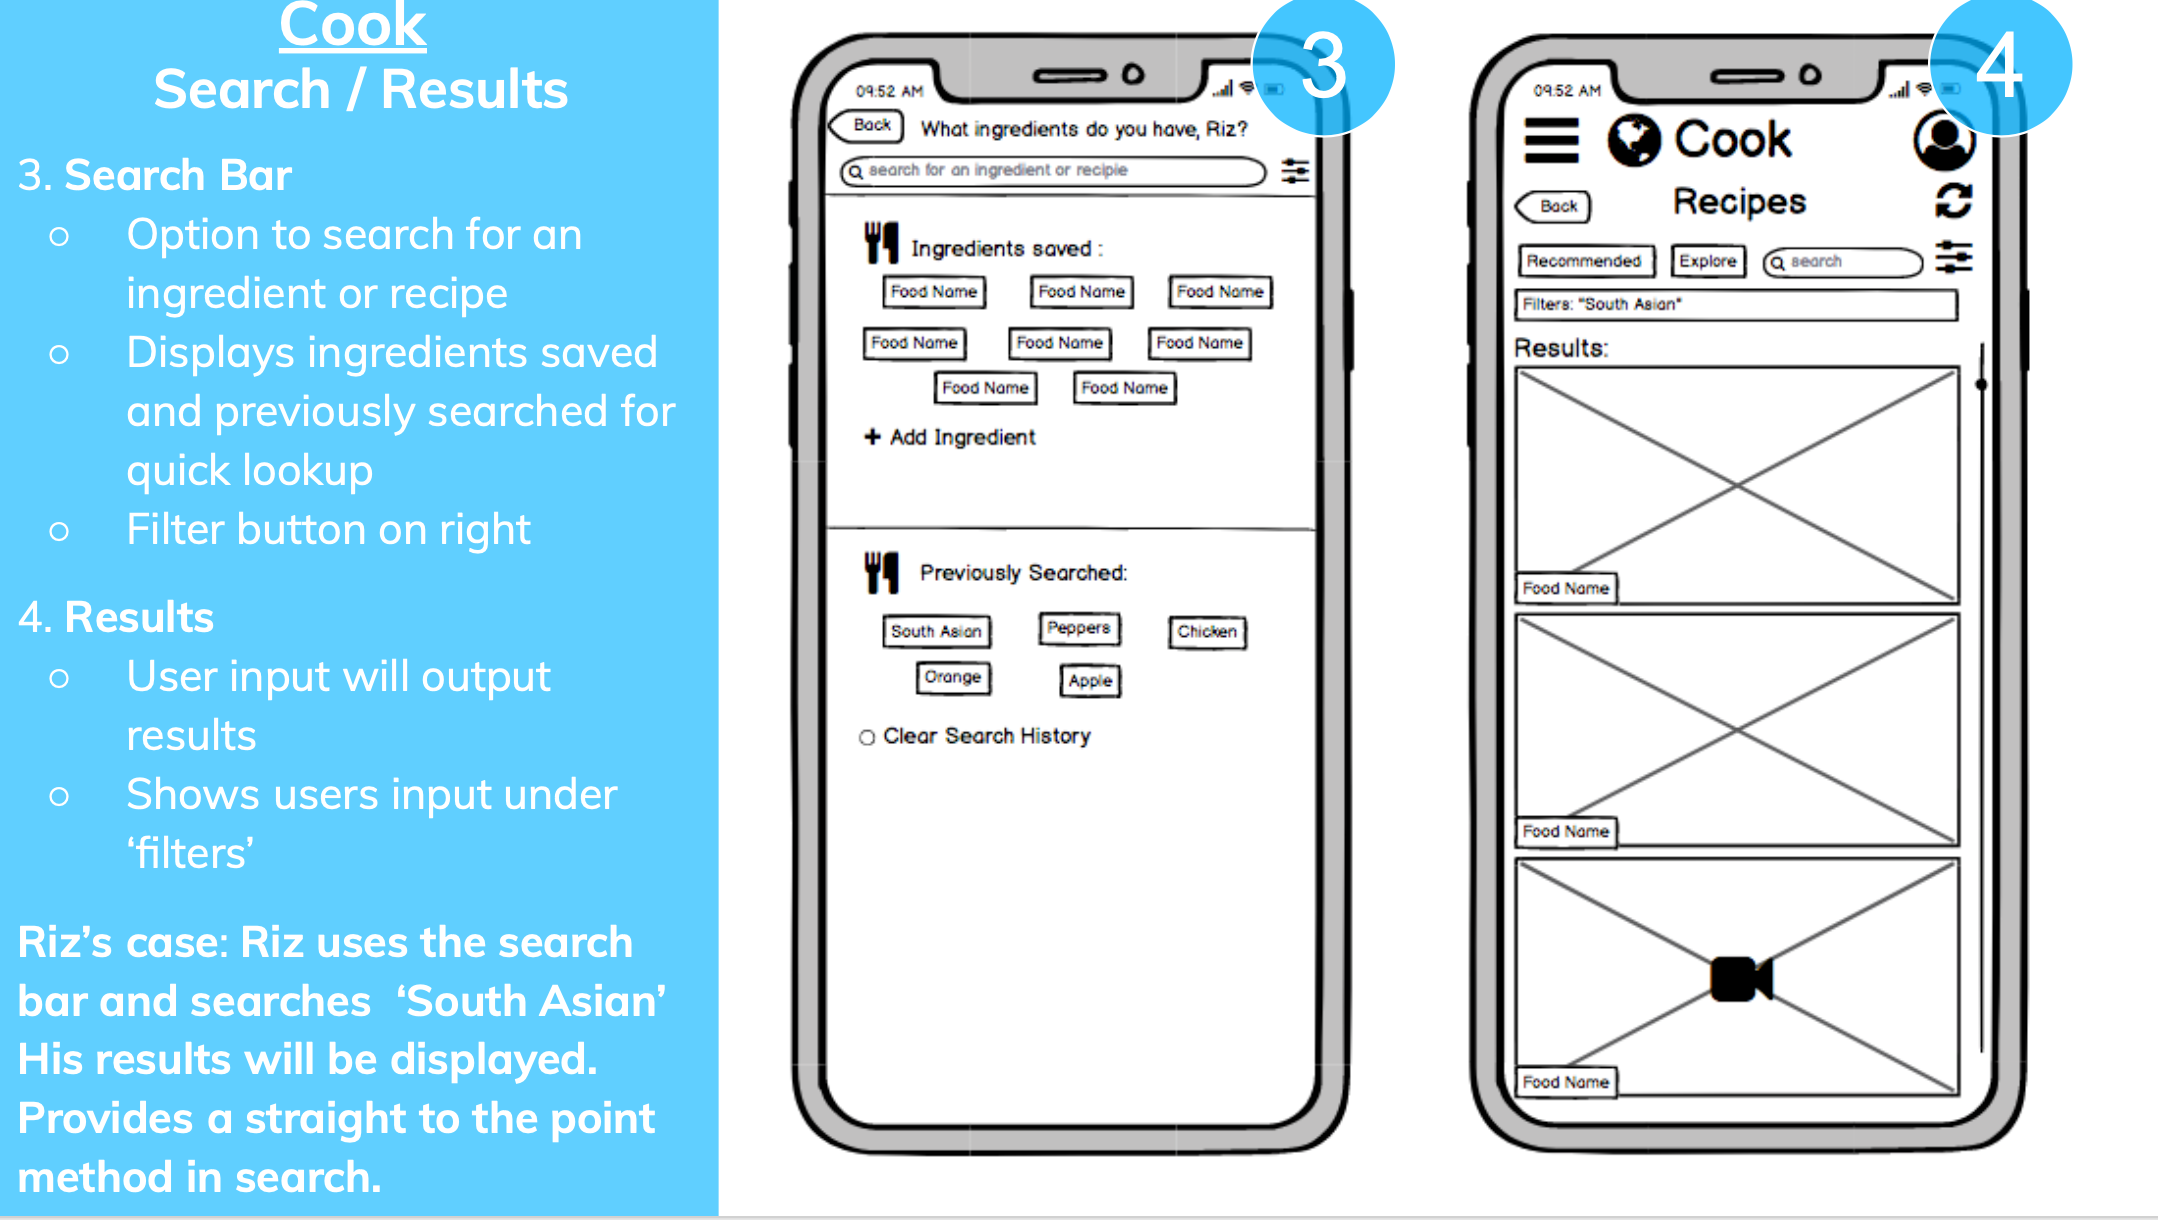
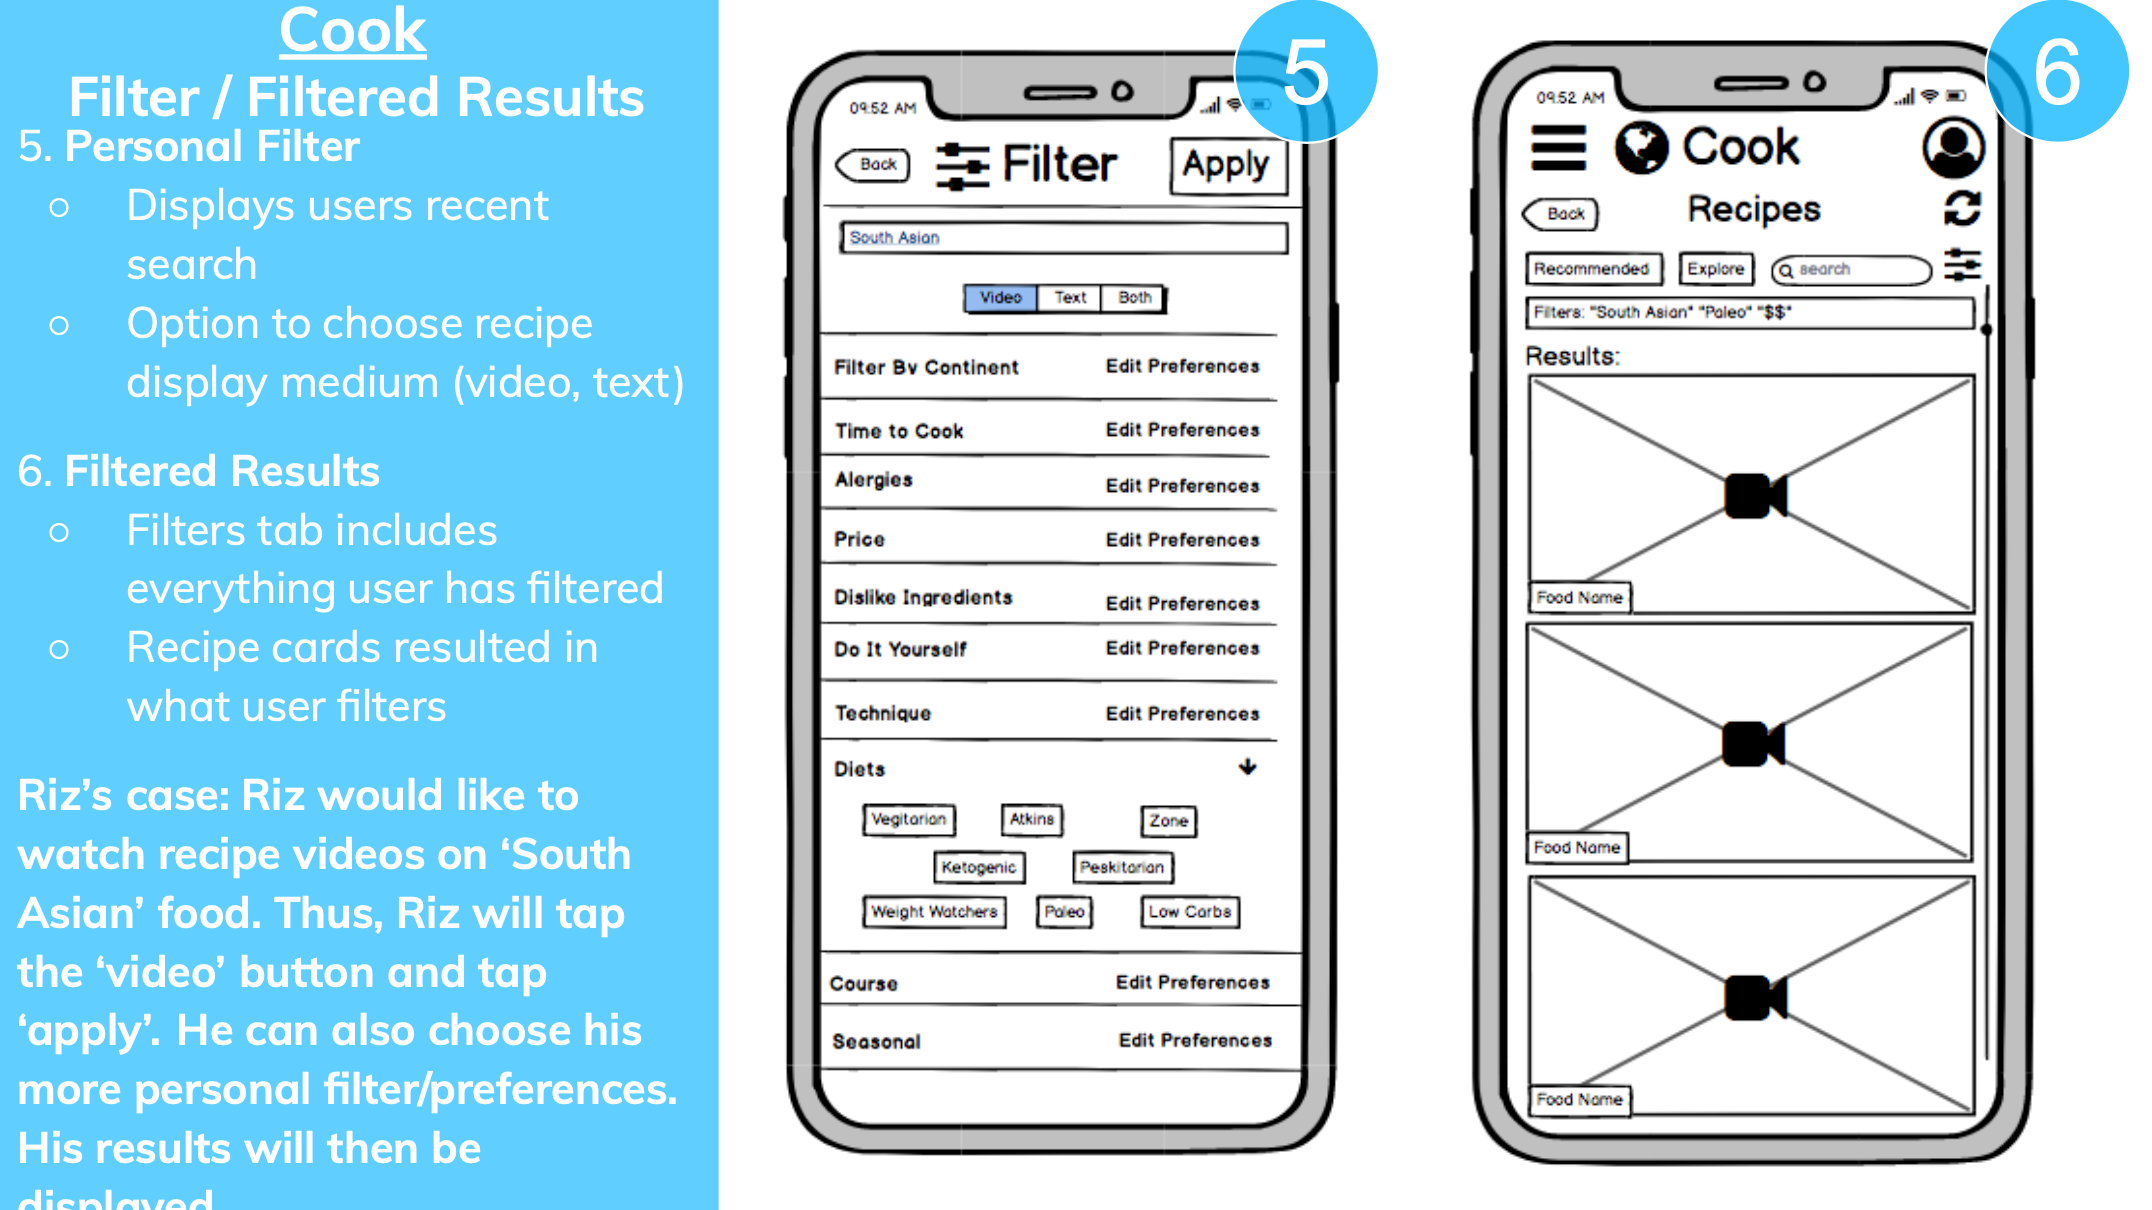

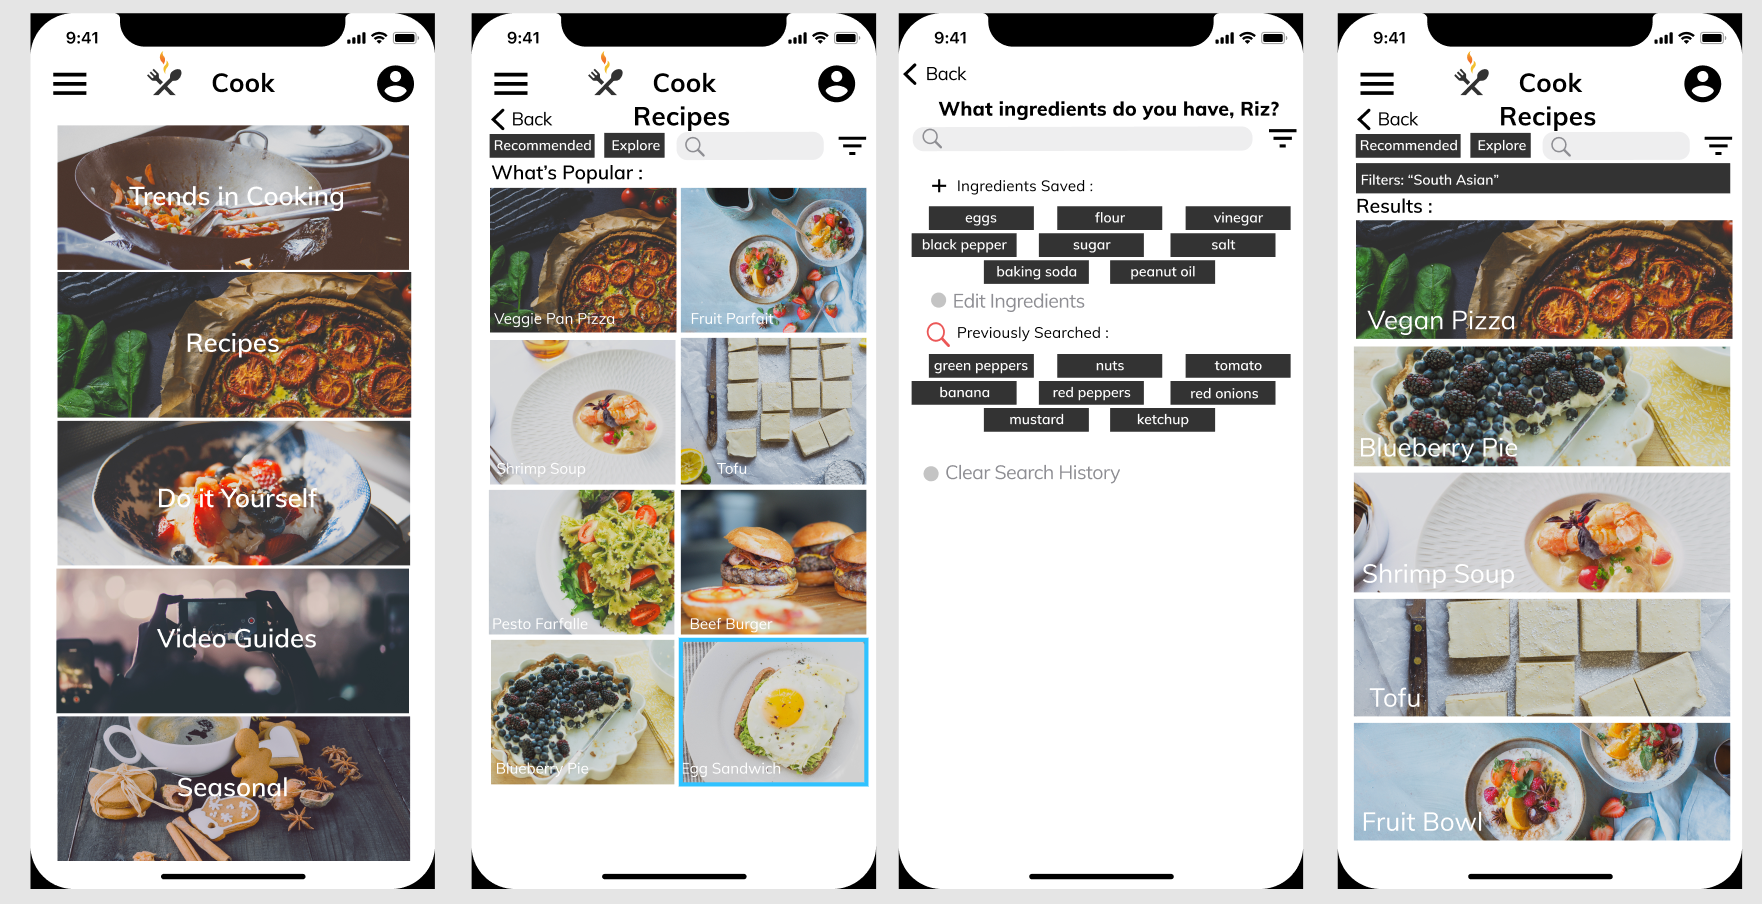
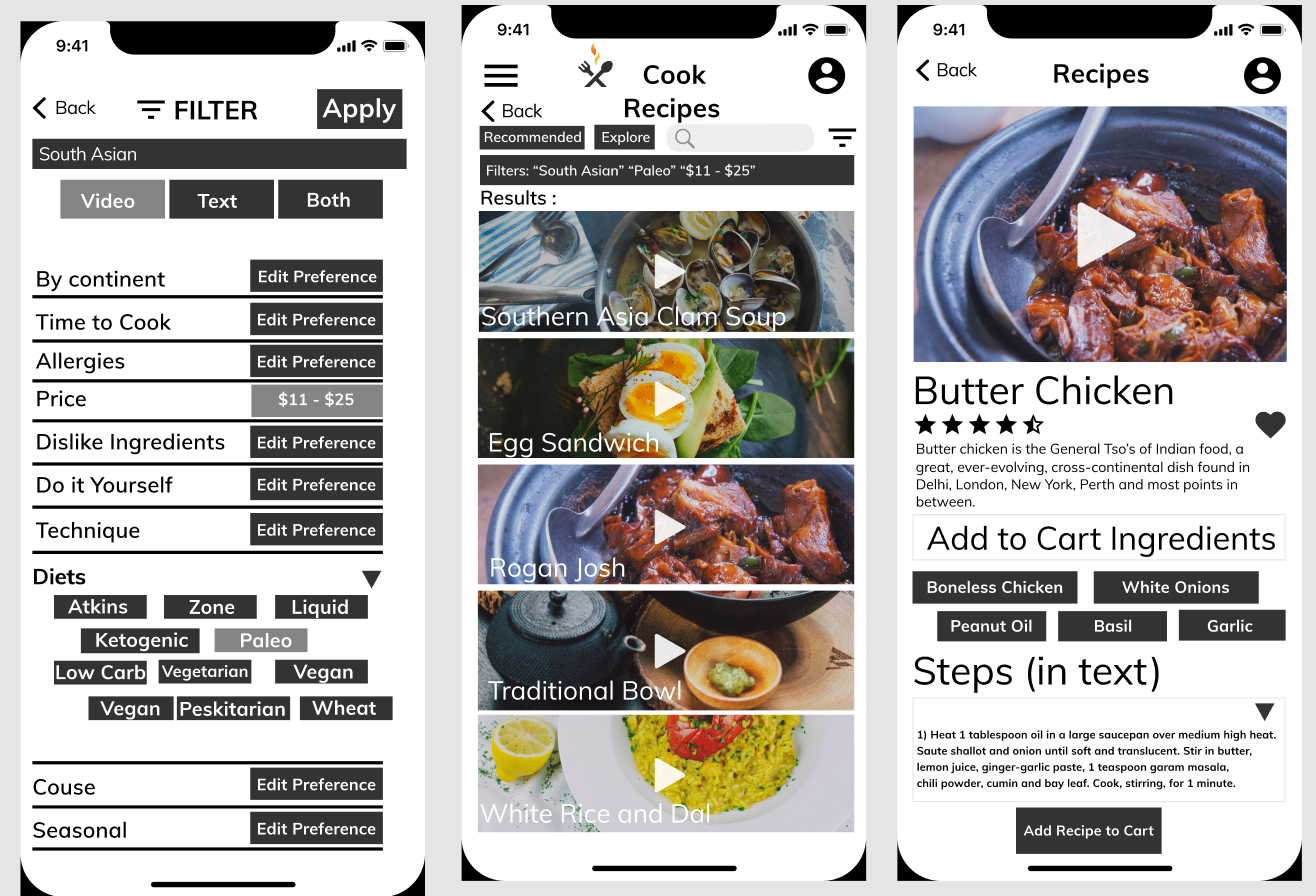
Here is what it looks like in theory, of how a user would use this mobile application.
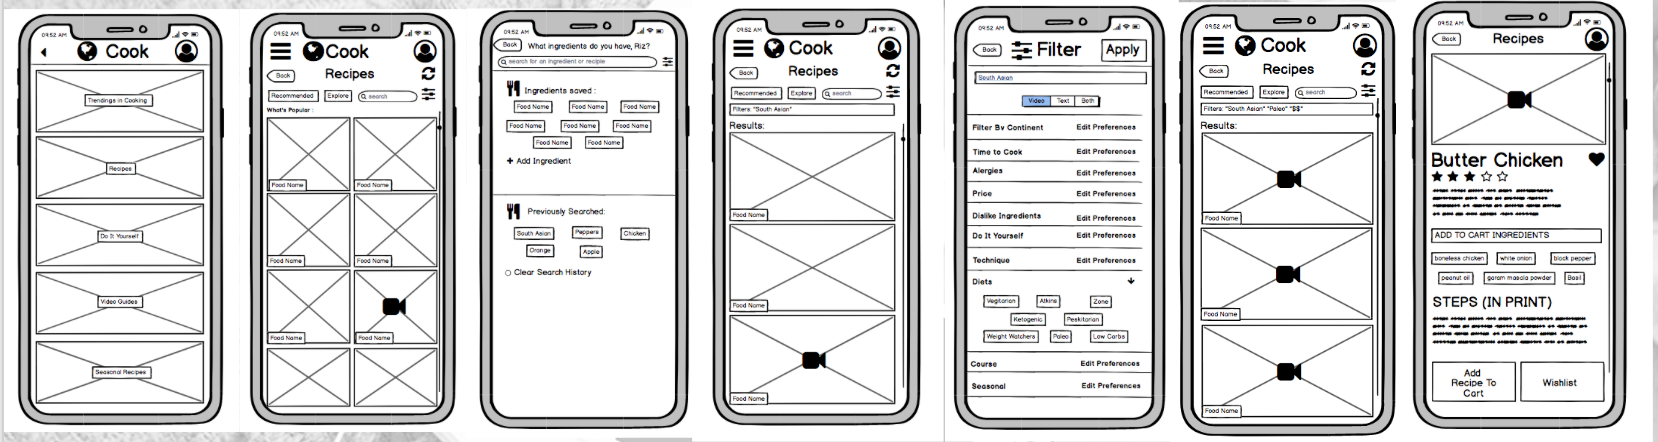
This is our product mockup with high fidelity mockups, translated from our low fidelity protoypes.
Students come to the University of Washington for a multitude of reasons, whether it be to further their education, get a degree, or to figure out what they want to do for the rest of their lives. For many, reaching their goals include enrolling in difficult courses. Students that struggle or have questions with the content of said courses are only offered help through office hours, or CLUE sessions late at night. Here lies one problem with the current system, for some students, they are not able to attend said office hours or extra sessions for help.
CREATED WITH: Adobe Illustrator, Adobe Photoshop
In order to solve our problem, we decided to create our product as an extension of Canvas. By doing this, we decrease the gap between the user’s goal and the means needed to execute said goal. Rather than create a completely separate app or website, which requires the user to go somewhere completely different, create or link an account and making separate login credentials; AssignmentAider will be a part of Canvas so all the user will need to do is log in to Canvas to access our site. It is a means to have another facet for students to get additional help if they can not attend office hours or clue sessions. This solution gives students access to help that fits into the student's schedule. Students are able to quickly direct themselves to the problem that they need additional assistance on, or a quick source of guidance on the material that they are currently learning in class. This will help pace students based on their desired progress because given our feedback from our survey questions, students feel either rushed, or slowed when attending clue and office hours because of the limited time that they have or the amount of students attending the same event.
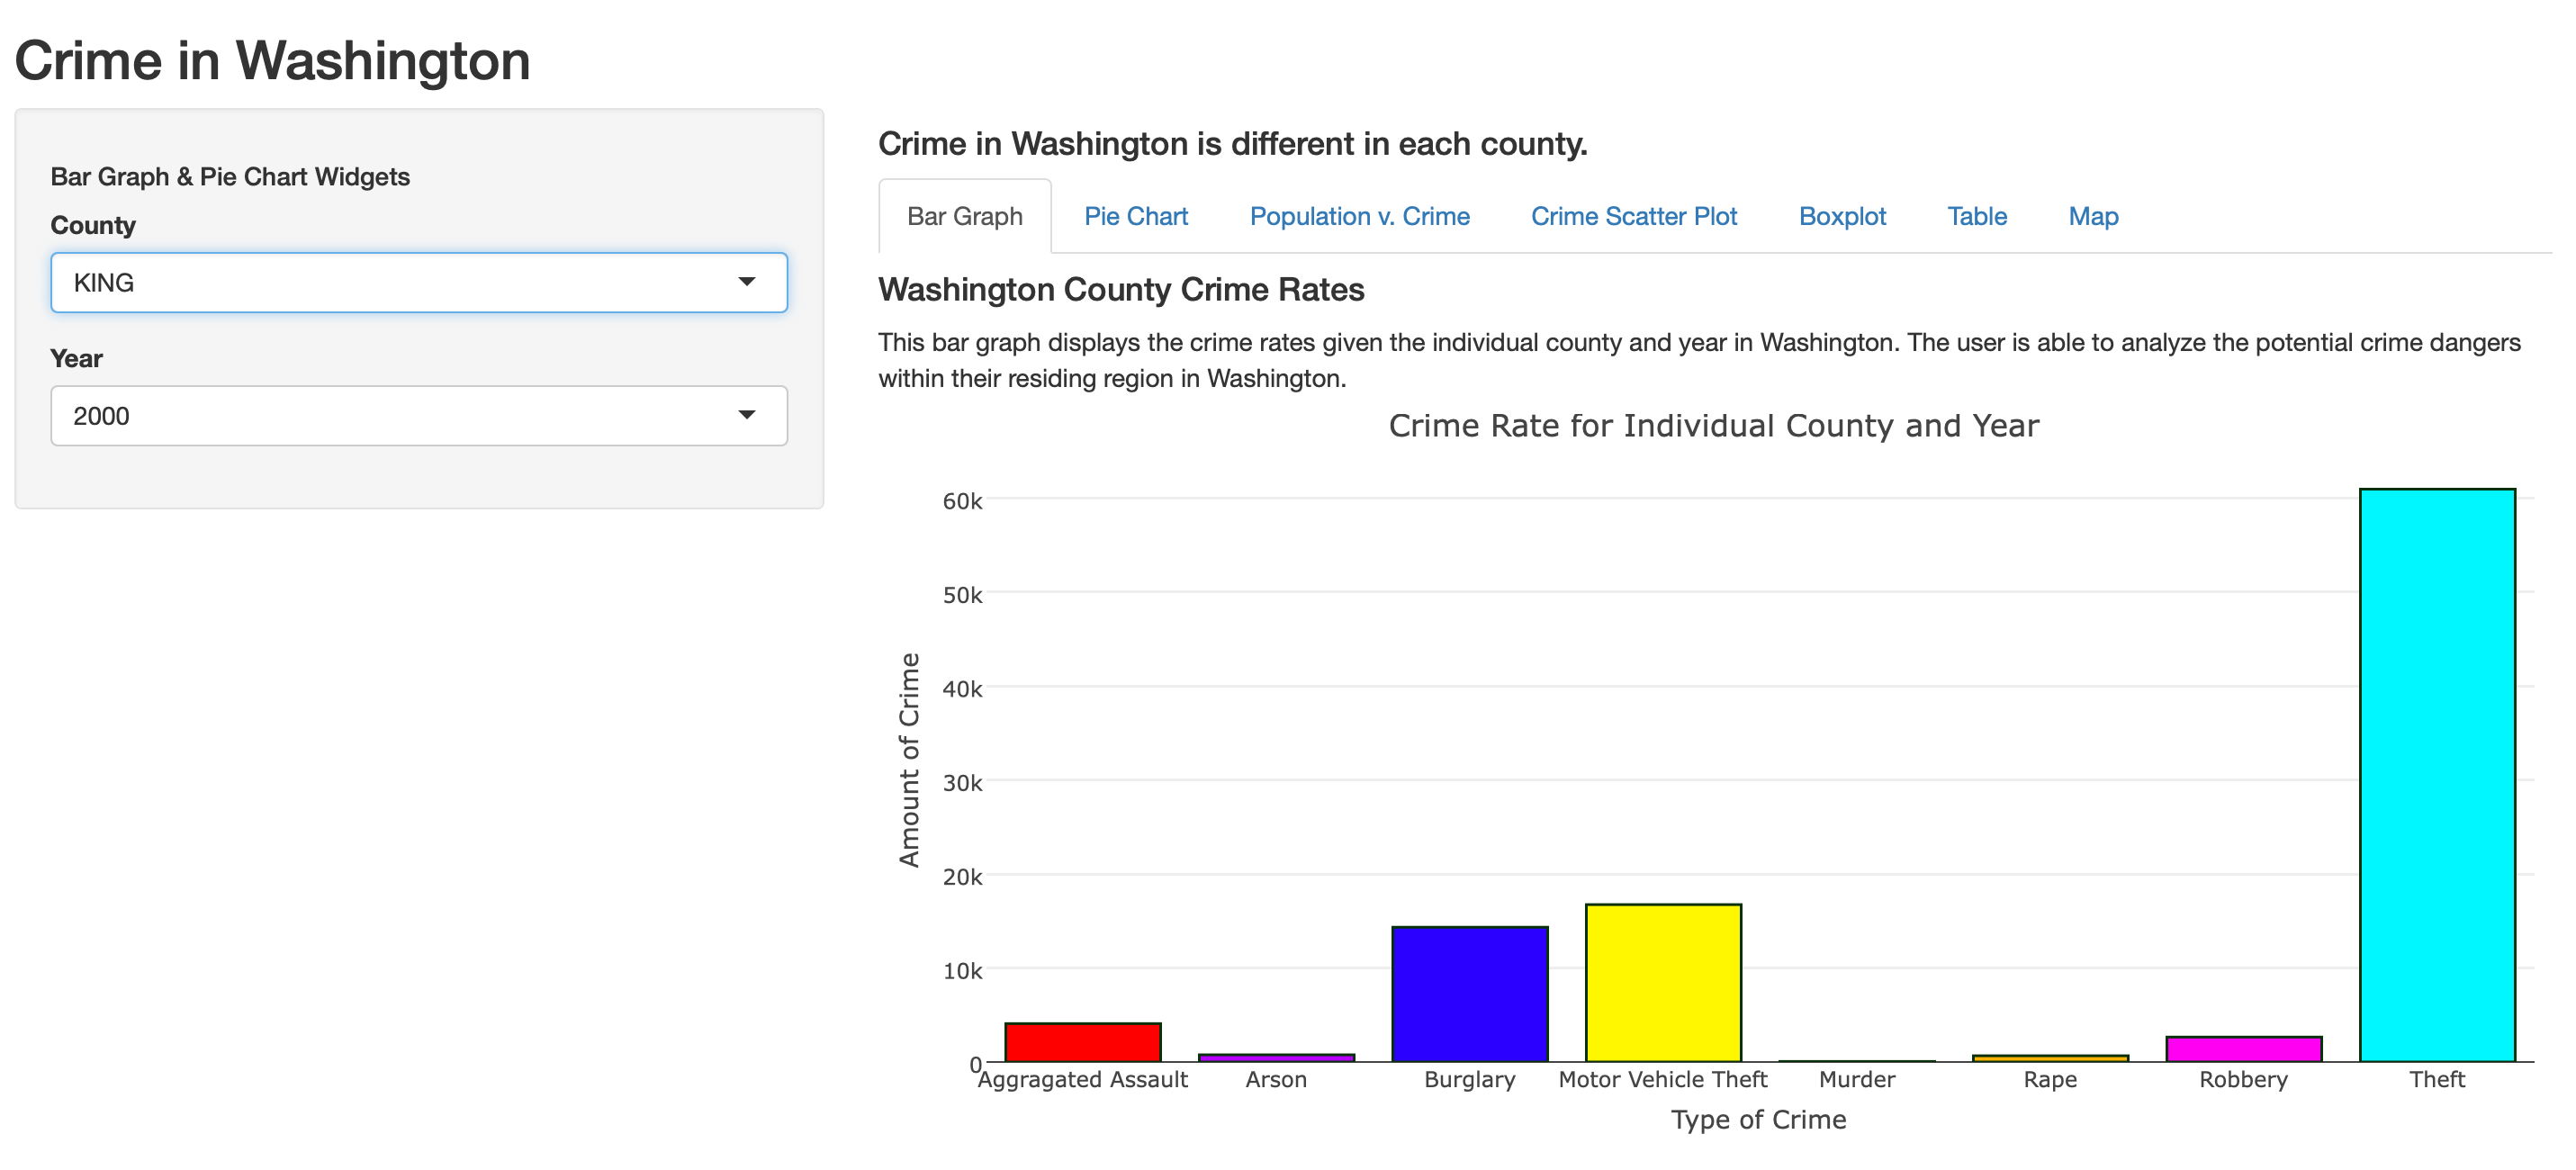
This app allows users to see the most frequented crimes within their state. Specifications can include their county, zip code, city, and year. It provides over 1000 entries specifying the type and number of crimes committed.
BUILT FOR:INFO 201: R - Based Programming
Winter 2017
ROLE: Programmer
CREATED WITH: R - Studios, Washington Crime Rates from Data.gov
The data our group extracted shows the crime committed in Washington State.We used shiny app that displays multiple graphs of different types of data represented. The bar graph displays the type of crimes and the amount of crimes committed for a specific individual county and year. The pie also does the same thing, but in a pie chart form. The scatter plot compares the average population to the total crimes, showing correlation, and the second scatter plot displays the number of occurance of the crime the user chose in each county. The boxplot shows the overall statistics of the different crimes being committed in a given county. The map of the state shows the highest crime committed within a certain county.


https://catalog.data.gov/dataset/washington-state-criminal-justice-data-book/resource/ee04f2a9-d77a-4bf8-bb70-32dcfdbfeae7
BUILT FOR:
INFO 362: Visual Information Design
Winter 2018
ROLE: Design
CREATED WITH: Adobe Illustrator, Adobe Photoship, Tablaeu
Winter 2018 at the University of Washington. I created a visual infographic on the topic of Kobe Bryant. We used Tableau and other visual design tools such as Adobe Illustrator, Photoshop, and Movie Maker. Learned to solve design problems, give and receive critique, follow an iterative process of design refinement, and gained technical skills. Learned the fundamental nature of visual potential, visual design principles, and the impact of color and typography. I documented my models, design process, feedback, iterations, and video that can be located on wix.

DESIGNED FOR: INFO 343 - Client Side Web Development
CREATED WITH: HTML/CSS/JAVASCRIPT
This website was created for our Info 343 - Website Development Class. We use the Yummly api to generate recipies that is based on the ingredients that people would have at home. The intended idea of this website was to create an applcation/website to combat food waste. If users do not know what to do with type ingredients, then using the Yummly API along with this platform reduces the waste built on throwing away food for no good reason.
DESIGNED FOR: INFO 200 - Intellectual Foundations FALL 2016
ROLE: UX DESIGNER
CREATED WITH: Invision
The most prevalent existing solution to treat Alzheimer’s are consumable drugs. These drugs include cholinesterase inhibitors and memantine to treat the cognitive aspect of the disease. Although these drugs slow the progression of Alzheimer's, there are side effects to taking it. Patients often experience nausea, vomiting, drowsiness, and other health deteriorating effects. For example, cholinesterase helps with a person's ability to think clearly, but at the same time, it can degrade their neurotransmitters. Although memantine helps with memory and learning, it also exposes cells to greater amounts of calcium, which can be damaging. Cholinesterase and memantine can be improved by eliminating most of the side effects but this is not possible because if the chemicals inducing the side effects were removed, the drug won’t subdue Alzheimer’s anymore. Additionally, treating other parts of the brain with cholinesterase inhibitors and memantine, and not solely the cognitive part, would be another possible improvement. This is where we introduce an applcation, integrated with the fitBit app that 'prevents' people from inhibiting symptoms that will soon lead to Alzheimer's.
We are going to serve an aging generation of “Baby Boomers” by investigating how we can revolutionize treatment for Alzheimer’s disease through the use of information technology. In particular, we will be looking to help patients by preserving their memories (and therefore their relationships) that they have
shared with people close to them, including their partners, friends, and family. This problem area should be addressed because living with a condition such as Alzheimer's severely impacts a person's functionality and their relationships with people that they truly care about. Though from a conventional standpoint
there is a large amount of funding, the people afflicted by Alzheimer's are underserved from a technology standpoint.
Additionally, this creates a new profit opportunity for our group as this innovative product has the potential to become a very effective alternative to drugs. If we can integrate this product as a well established treatment, then we can fulfill an already established market need.
There has been developments of virtual reality environments for people with Alzheimer's, allowing them to interact with things that they often could not. For example, a virtual reality environment, created by Opaque Multimedia, has been used to deliver sensory therapy to patients with Alzheimer’s. Called “The Forest Project,” the application achieves this by creating a hyper realistic forest environment that patients can experience and enjoy. Elements such as sunlight, butterflies, snow, and flowers are some examples of what the virtual environment can offer to evoke a sensory and emotional response from patients. In order to become an effective form of treatment against Alzheimer’s, sensory therapy through virtual reality has to trigger other senses as well, such as the olfactory and tactile senses, while providing an even higher degree of realism.
Hsu, a teacher with two children in his late thirties, wants to get back in shape. As he is beginning to age, he is becoming more mentally drained because of the amount of work that is put on him. He is forgetting to input students grades into the grade book and forgets to assign daily assignments. In his efforts to get back in shape, Denrick purchased a fitbit that can help him track his personal health, but he is not familiar with the current technology. Once he downloads the app, it will prompt him to customize his personal profile. It will ask for his weight, height, age, and gender to best personalize his account. From here, the app gives a more in-depth tracking system that tracks your mental and physical state, how much water you have consumed, your weight, your meals, and your memory retention. Once finished with the activities, the application automatically calculates the evaluation and thus directs Denrick to his individualized score. The data is then displayed on a graph, so it will be easier for him to view his progress. After the span of a couple of weeks and multiple daily evaluations, Denrick sees a dramatic decline in his memory. The application automatically pops up a message that says, "We have detected an unusual decline in your memory retention that requires attention. Please contact your medical provider to find out what steps to take next.” Denrick is prompted to see an actual doctor as the app detects that there is a potential he might have Alzheimer’s or a similar condition that affects his cognition.
Shaquita Liore, a receptionist at Allegren Pediatrics, is a fifty-year old obese woman who is divorced. She has a son, Jamie, who is nineteen and just starting college. She needs to pay for his tuition, but financial problems have been overwhelming. She has trouble processing the information told to her when she is inputting information about the patients into the computer. She will occasionally forget the name she just typed in. She recently visited the doctor for her yearly visit and due to her weight, inactive lifestyle, and overall stress, the doctor determined she was fairly susceptible to Alzheimer’s disease. So, the doctor prescribed a fitbit to Shaquita and it was paid for by her insurance. Shaquita has two goals: lose weight and increase her memory retention. After the memory activities have been finished, Shaquita is told that she is done for the day and the app synthesizes all of her data into graphs that display a trend. In a month, Shaquita and her doctor will be able to evaluate if her memory retention is getting worse or better and detect early signs of Alzheimer’s before its onset.